Open the filter dialog on a game page and, below the conditions, there is a small Backtest row: a window of 100, 200 or 300 draws, a Run button, and a result block. The percentage looks like a score for the filter. It is really a coverage figure: the share of draws in that window the screen would have kept.
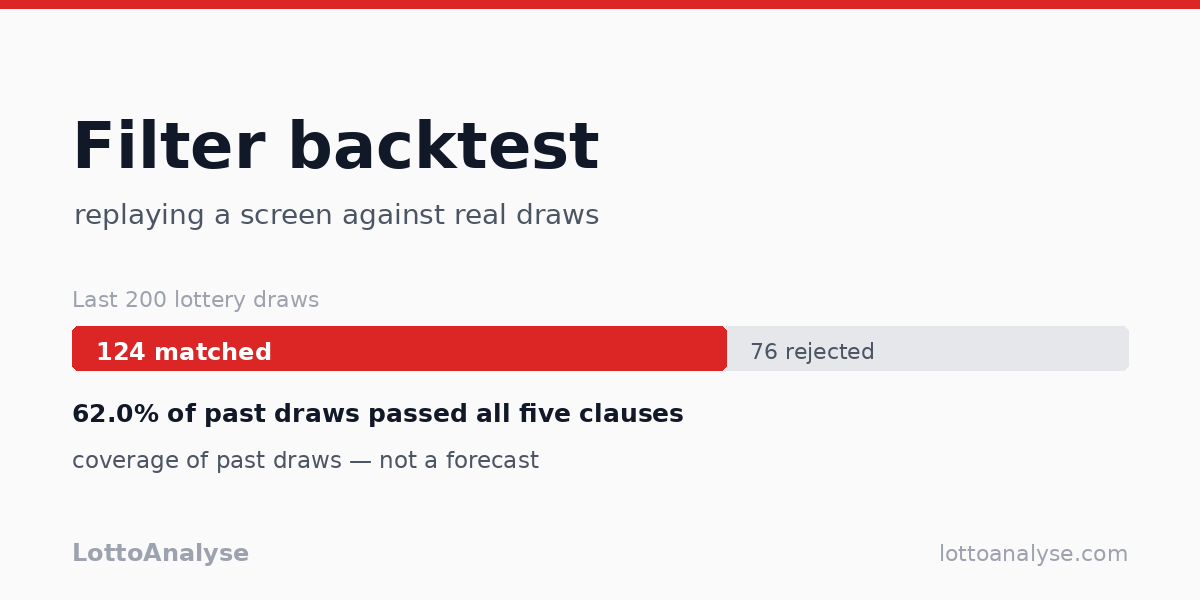
A filter cannot improve your chance of winning. Every combination has the same probability in every draw; a screen only chooses which combinations you cover. It can also exclude the winning combination: in the 200-draw sample below, the screen would have rejected 76 actual winning draws, 38% of them. If the drawn combination falls outside the screen, the filter has turned a winning combination into a losing one for that draw.
What the button counts
A filter clause is one metric plus one threshold. The dialog holds eight of them: sum, odd/even, zone ratio, AC value, consecutive pairs, repeat count, variance and span. The Backtest takes whichever conditions are currently set and replays them over real draws.
The backtest does four things:
- read the active conditions from the dialog, using the same function as the Filter button;
- fetch the selected window of recent draws, plus one older draw;
- compute each draw's front-area metrics and apply every active clause;
- report usable draws, draws that passed every clause, and the percentage.
The extra older draw supplies the baseline for the repeat clause. In a backtest, a draw's repeat count is measured against the draw immediately before it, as in the statistics table. The filter dialog's repeat clause measures against the latest draw instead, because a candidate combination has no previous draw of its own.
Only the front area is screened. In Powerball that is the five white balls; the Powerball sits outside every clause. Average is not a filter either: it is the sum divided by the number of front balls, so it adds nothing once the sum is fixed. The statistics guide defines each metric.
A 200-draw run
The screen below is the one used in the companion article. The thresholds are an arbitrary example, chosen to be readable rather than recommended:
| Clause | Setting |
|---|---|
| Sum | between 110 and 210 |
| Span | at least 25 |
| Odd/even split | not 5:0 and not 0:5 |
| Consecutive pairs | at most 1 |
| Repeats | at most 1 |
Run it on the dialog's default window, the last 200 Powerball draws from 20250707 through 20261014, and the result block says:
Last 200 draws: 200 usable, 124 matched (62.0%)
The result block also breaks the count down by clause. These are marginal counts: each answers "how many of the 200 draws satisfy this clause on its own?"
| Clause | Draws matching it (of 200) |
|---|---|
| Sum between 110 and 210 | 142 (71.0%) |
| Span at least 25 | 196 (98.0%) |
| Odd/even split not 5:0 or 0:5 | 186 (93.0%) |
| Consecutive pairs at most 1 | 196 (98.0%) |
| Repeats at most 1 | 194 (97.0%) |
| All five at once | 124 (62.0%) |
The rows overlap, so they do not sum to 124. The combined figure is a direct count of draws that passed all five clauses. Multiplying the five rates gives 61.5%, close to the measured 62.0%, but that agreement is a property of this window rather than a rule. The companion article found the same near-match on a different 100-draw window.
Three windows, three samples
The dialog offers three windows. The same five clauses give:
| Window | Draws (range) | Usable | All five matched | Pass rate |
|---|---|---|---|---|
| Last 100 | 20260225 – 20261014 | 100 | 64 | 64.0% |
| Last 200 | 20250707 – 20261014 | 200 | 124 | 62.0% |
| Last 300 | 20241116 – 20261014 | 300 | 188 | 62.7% |
The windows overlap, so the rates stay in the same neighbourhood. The companion article's 100-draw window ended on 20261005 and gave 62 of 100; the last 100 draws now end on 20261014 and give 64 of 100. Different 100-draw windows give different counts. A backtest rate means little without its window and end date.
What 62% covers
The Backtest counts real winning draws that would have passed the screen. It does not walk the 292,201,338 possible combinations. Each draw contributes the one combination that was actually drawn, so 124 of 200 describes past draws, not the size of the surviving combination space.
If you want the share of all possible combinations that pass, that requires enumerating or sampling the whole space; this article only replays draws. Your chance of winning is a separate question. Every combination has the same probability in every draw, and no filter adds probability back. A rejected draw is a real winning combination that the screen would have excluded. The pass rate tells you what share of past winning draws the screen kept; the rest is the share it removed.
A filter can also filter out the jackpot. In the 200-draw sample, 76 actual winning draws would have been rejected. If one of those had been the draw you were playing, the screen would have guaranteed a miss. A 62% pass rate is not a 62% chance of winning: it is the share of past winning draws the screen kept. The other 38% is the share it turned into losses.
Which clause does the rejecting
Marginal counts do not identify the binding clause. A draw can fail one clause or several, and the per-clause line does not say which. Recomputing the same 200 draws one at a time gives this breakdown of the 76 rejected draws:
- 50 failed only the sum clause;
- 11 failed only the odd/even clause;
- 5 failed only the repeat clause;
- 1 failed only the consecutive-pair clause;
- 9 failed two or three clauses at once.
Two draws show how the sum band does most of that work. 20261010 came out 1, 4, 19, 33, 51. The sum is 108, two below the lower bound, while the span (50), odd/even split (4:1), consecutive pairs (0) and repeats (0) all pass. 20260926 came out 14, 40, 52, 55, 57: sum 218, eight above the upper bound, again with every other clause passing. The band cuts both ways.
Repeat is the next most common single cause. 20260720 came out 2, 9, 44, 53, 59 and passed the other four clauses, but it shared 9 and 44 with 20260718 (9, 14, 44, 50, 56). Its repeat count was 2, so the repeat clause rejected it.
Span and consecutive pairs each have a marginal count of 196 out of 200, yet only one draw failed on consecutive pairs alone and none failed on span alone. A clause can look almost always satisfied and still matter when it is the last one standing. Several mild clauses can still remove more than a third of the draws, because they compound.
Messages in the result block
| Message | What it means |
|---|---|
| No conditions set — every draw passes | No clause is active. There is no denominator, so the block does not print 100%. |
| N draws skipped (drawn count ≠ pick size) | A draw has a different number of front balls than the game's pick size, so the clauses cannot be applied. |
| Only M draws in history — all of them were used | The game has fewer than the selected N draws; the rate uses what exists. |
| No usable draws | No draw in the window has the right number of front balls. |
| Conditions changed — numbers below are from the previous run | A condition was edited after the last run; press Run again. |
| Repeat is counted against the draw before it | The repeat baseline in a backtest is each draw's own previous draw. |
The skipped-draw case is not an error. A game can draw a different count from the count you pick; Pick 10, for example, draws 20 numbers while the picker selects 10. A metric such as the sum is defined for the pick size, so counting those draws as failures would turn a definition mismatch into a misleading 0%.
Using it as an audit
Change one clause at a time if you want to see which one is doing the work. Run all three windows; a sharp swing means the sample is small or the screen is unstable. Quote the window with the rate: "62%" on its own cannot be checked.
The Backtest is a replay, not a tuning tool. Picking thresholds because they maximize the past pass rate fits the window; it gives the next draw no memory of the last 200. Draws are independent. The button tells you how often the actual winning draw would have passed your conditions in a stated window, and that is where its claim ends.
A filter does not raise the probability of any combination. It can reduce the number of combinations you cover, and therefore the cost, but only by accepting that you may exclude the one that is drawn. The backtest is evidence for that trade-off, not a score to maximize.
Where the numbers come from
The draw data is the last 200 Powerball draws from 20250707 through 20261014, plus draw 20250705 as the repeat baseline. The game is 5 numbers from 69 plus 1 from 26, with zones 1–23, 24–46 and 47–69. The counts use the same eight clauses and the same all-or-nothing rule as the filter dialog; none of them are rounded from another source.
For the metric definitions, see Every Statistic on This Site, Explained. For the screen's arithmetic and its limits, see Lottery number filters: what a statistical screen can and cannot do.