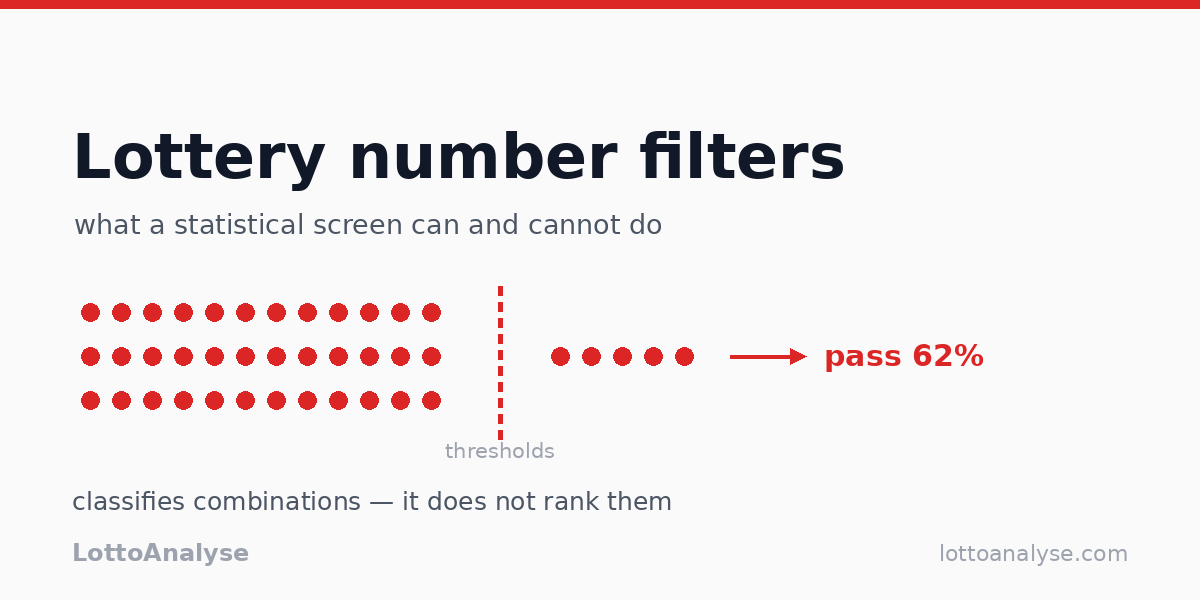
A 5/69 + 1/26 game has 292,201,338 possible combinations. That figure comes from this site's own game configuration for Powerball, and it explains why filtering is attractive: instead of scanning the whole space, you write down a handful of rules and let each combination pass or fail on its own statistics.
The arithmetic is worth doing once by hand. The last 100 Powerball draws stored on this site, draw 20260216 through 20261005, make a useful test case.
The nine numbers a screen can read
Every draw on this site is broken down the moment it is stored, and the same nine values can be produced for any combination, drawn or not.
| Metric | What it measures (front numbers) | 20261005: 16, 23, 32, 36, 54 + PB 9 |
|---|---|---|
| sum | the five front numbers added together | 161 |
| span | largest minus smallest | 38 |
| odd_even | odd count : even count | 1:4 |
| area_ratio | how many numbers fall in each zone (1–23, 24–46, 47–69) | 2:2:1 |
| ac_value | how far apart the numbers sit from each other | 6 |
| consecutive | pairs of front numbers differing by 1 | 0 |
| repeat_count | front numbers shared with the previous draw | 0 |
| average | mean of the five | 32.2 |
| variance | variance of the five | 167.4 |
What a filter is, mechanically
A filter is a list of conditions. Each condition is one comparison operator plus one metric threshold. The procedure is the same four steps:
- set the metric thresholds and the comparison operators;
- compute those metrics for the candidate combination;
- compare each computed value with its threshold;
- keep the combination only if every condition passes.
The screen below uses arbitrary thresholds, chosen to be readable rather than recommended:
| Condition | Draws in the window that satisfy it |
|---|---|
| sum between 110 and 210 | 71 / 100 |
| span at least 25 | 98 / 100 |
| odd/even split neither 5:0 nor 0:5 | 93 / 100 |
| consecutive pairs at most 1 | 98 / 100 |
| repeats from the previous draw at most 1 | 97 / 100 |
| all five conditions at once | 62 / 100 |
Across those 100 draws: the sum ranged from 93 to 276 with a median of 177.5 and a mean of 179.2; the span ranged from 14 to 66 with a median of 49.5; 76 draws contained no consecutive pair; 72 repeated nothing from the previous draw; and the most common odd/even split was 2:3, which appeared 34 times, while an all-odd front (5:0) appeared 5 times.
The rows overlap, and the 62 of 100 is a count of draws, not an estimate for the combination space. Multiplying the five marginal rates gives 61.5%, close to the measured 62%; that closeness is a coincidence of this window, not a rule. A sum near the middle, for example, is common among draws because an enormous number of combinations add up to it. How many of the 292,201,338 combinations pass all five conditions is a separate question: answering it takes an enumeration or a sample of that space, which this article does not attempt. The draw pass rate and the combination pass rate are different quantities, even when they land near each other.
One condition is usually decided by a single draw
Two draws from the window show how a single comparison decides the outcome.
- Draw 20260930 came out 4, 6, 23, 33, 44 with Powerball 13. Its sum is 110, exactly on the lower bound, so it passes that condition rather than missing it by one.
- Draw 20261003 came out 4, 42, 44, 55, 59 with Powerball 14. Its sum (204) and span (55) sit comfortably inside the thresholds, but its repeat_count is 2, so the last condition rejects it.
The two draws look similar on the headline statistics and end up on opposite sides of the screen because of one comparison.
What the screen does not do
The arithmetic has limits.
- It classifies; it does not rank. All 292,201,338 combinations have the same probability in every draw. A combination's statistics do not make it more or less likely than any other single combination.
- "Typical" is about how many combinations share a shape. A sum near 177 turns up often because an enormous number of combinations add up to something near it. Keeping statistically typical combinations therefore keeps a large share of the space, which is the opposite of narrowing it down.
- Draws are independent. repeat_count was 0 in 72 of the last 100 draws. That describes the past 100 draws; it puts no obligation on the next one, and no measure is "due" to appear.
- A screen can only remove combinations. Your chance of holding the winning one follows the size of the set you actually cover. Filters do not add anything back: they change which combinations you cover and what covering them costs, not what a combination is worth.
- Conditions compound. Five conditions that each look gentle can remove more than a third of the space, and every removed combination is one fewer chance of holding the winner. Adding conditions shrinks the set you cover; the Backtest button shows by how much.
How to read these numbers instead
The same nine metrics describe rather than judge:
- Describing a draw that already happened. 20260930 is a good example: sum 110, a 3:2:0 zone split, and no repeats from the previous draw.
- Checking the shape of a set you already hold. Which zones are covered? Do any two numbers sit adjacent? How far apart are the smallest and largest?
- Auditing claims. Because every draw is stored with the same nine values, a statement like "high sums are rare" can be checked against a specific window instead of repeated from memory. In these 100 draws the sum reached 276 and the median was 177.5; always state the window.
Where the numbers come from
Every value above comes from this site's public lottery endpoints: stats for the last 100 Powerball draws (20260216 – 20261005, newest first) and types for the game configuration (5 numbers from 69, 1 from 26, zones 1–23 / 24–46 / 47–69). The nine metrics are the ones the site computes and stores for every draw.
A filter tells you what a combination looks like next to a set of thresholds. It says nothing about which combination will be drawn.