LottoAnalyse keeps a clean, complete history of the official draws from eleven US lottery games, computes the statistics behind every one, and gives you three ways to read them. It sells no tickets and makes no predictions.
Eleven games in one place
The site holds more than 83,000 draws across eleven games:
| Game | How it is played | History starts |
|---|---|---|
| Powerball | 5 from 1–69 + 1 from 1–26 | 2015-10-07 |
| Mega Millions | 5 from 1–70 + 1 from 1–25 | 2017-10-31 |
| NY Lotto | 6 from 1–59 + 1 bonus | 2001-09-12 |
| Take 5 (Evening) | 5 from 1–39 | 1992-01-17 |
| Take 5 (Midday) | 5 from 1–39 | 2021-07-26 |
| Numbers (Evening) | 3 digits, 0–9 | 1980-09-02 |
| Numbers (Midday) | 3 digits, 0–9 | 2001-12-02 |
| Win 4 (Evening) | 4 digits, 0–9 | 1981-07-21 |
| Win 4 (Midday) | 4 digits, 0–9 | 2001-12-02 |
| Pick 10 | 10 from 1–80 | 1987-01-12 |
| Millionaire For Life | 5 from 1–58 + 1 from 1–5 | 2026-02-22 |
The deepest archive is Numbers (Evening), which starts in 1980. The newest game is Millionaire For Life, added in February 2026.
The midday and evening versions of the New York games are kept as separate histories, so a number's record in the midday draw is never mixed with its record in the evening draw.
Three ways to look at any game
Open any game page and you get three tabs.
Statistics: the numbers behind each draw
Every draw is computed and stored the moment it arrives: the sum of the front numbers, the odd/even split, the zone ratio across the game's number ranges, the AC value (how scattered the numbers are), consecutive pairs, how many numbers repeated from the previous draw, and the average, variance and span of the set.
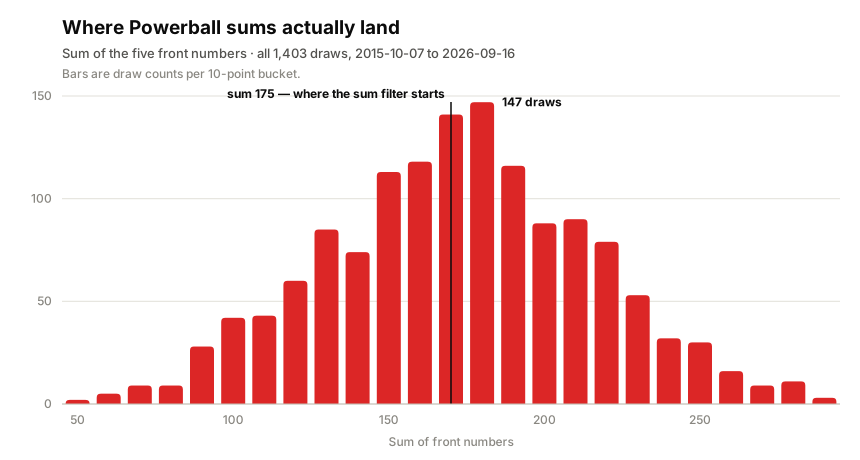
The chart above shows the distribution of sums: they cluster around the middle, and the extremes are rare.
The line at 175 is the minimum value of Powerball's sum filter: pick < and you have already narrowed the list to roughly the lower half of the distribution. Every game has its own starting value, and you can change it to whatever you like.
Distribution: what has not come up
The distribution tab is a table of omission values. There is one row per draw and one column per number, and each cell holds the number of draws since that number last appeared, so a 0 means the number came up in that row. Long droughts stand out as runs of large values, which is the fastest way to see how long each number has gone unseen.
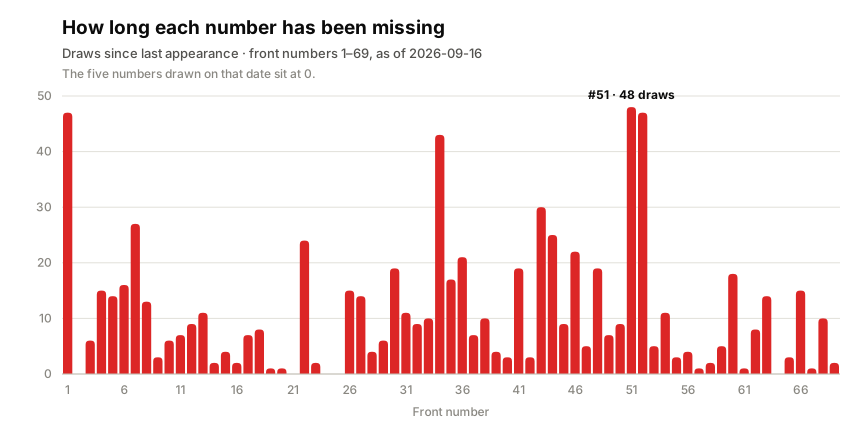
You can also draw tracing lines across the table, one per ball position (the smallest number drawn, the second smallest, and so on), or along diagonals and repeats, to follow a pattern down through history rather than looking at a single row.
Picker: choose your numbers, then filter them by conditions
The picker works the other way round from the tables. You click to select the numbers you like (you may pick more than the game's required count), and it generates every combination they form, which you then narrow down with eight conditions: sum, variance, span, odd/even split, zone ratio, AC value, consecutive pairs, and repeats from the latest draw. The panel shows how many combinations survive the filter, and what buying them would cost.
Each condition filters out a different slice of the possibilities, so it helps to know roughly what each one keeps on its own:
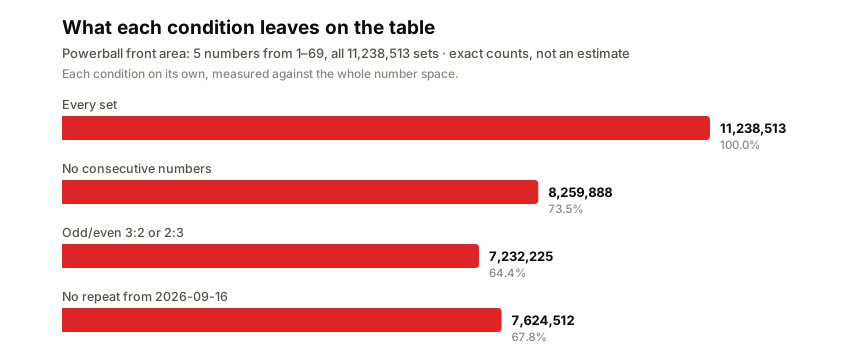
These counts are exact rather than estimated. Powerball's front area offers 11,238,513 possible five-number sets, and each bar shows how many of them that single condition keeps. Requiring an odd/even split of 3:2 or 2:3, for example, discards about a third of the space before you have looked at anything else.
Once you have a set of conditions you like, Backtest runs them against the last N draws and reports how many of those draws would have matched. It checks a rule against past draws.
More conditions remove more combinations; the Backtest shows the cost. Lottery draws are random events; the picker is a way to choose among combinations, not a way to improve the odds.
Where the numbers come from
Draw results come from New York State's public open data portal, which publishes the official results of all eleven games, including the multi-state ones, as machine-readable datasets. The site syncs twice a day, at 23:30 and 00:30 US Eastern, and recomputes the statistics for each new draw as it arrives, so the tables and the charts always describe the same history.
Links to each game's official site are in the footer; that is where the rules, the prize levels and the official announcements live. In the event of any discrepancy between this site and an official announcement, the official announcement prevails.
What this site is not
LottoAnalyse is an independent data analysis platform. It is not affiliated with, endorsed by, or connected to any lottery operator or government agency. We do not sell lottery tickets, buy tickets on your behalf, accept wagers, or guarantee any prize.
Draw results are provided for analysis and reference only. Please play responsibly. Minors may not purchase lottery tickets or claim prizes.